Debugging On Web Browsers
Most web browsers have their own debugging environment. We will demonstrate how to use the debugging tools on Google Chrome. Most web browsers will have similar tools available to the web developer. For this demonstration, we will work on the following HTML page.
<!DOCTYPE html>
<html>
  <body>
    <script src="greeting.js"></script>

    How to debug on a web browser.

    <script>
      greeting('Earthling');
    </script>
  </body>
</html>
The contents of the file greeting.js are:
function greeting(name) {
  let phrase = `Welcome, ${name}!`;

  popup(phrase);
}

function popup(phrase) {
  alert(`** ${phrase} **`);
}
We will load the page into Chrome and then use CTRL-SHIFT-i to display the developer tools on the right of the screen as shown below.
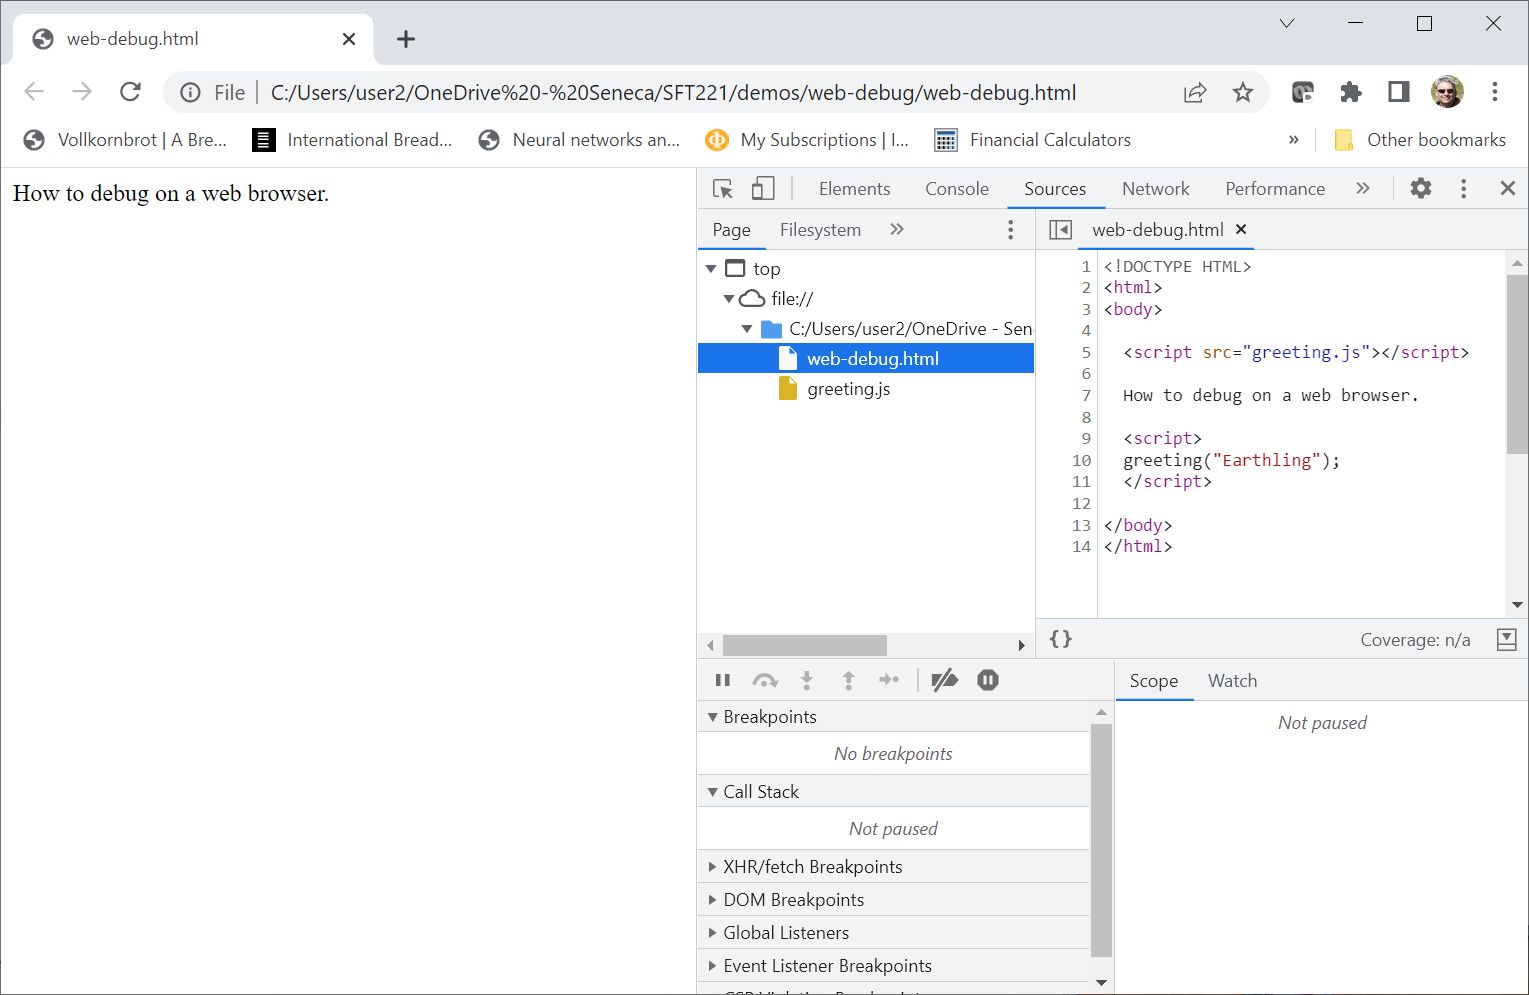
When the developer tools are first displayed, it shows the elements on the page in the pane at the top right of the developer tools. Clicking the Sources tab shows a list of the source files on the page and you can click one of them to display the contents of the file.
At the bottom of the developer tools, is the JavaScript debugging pane. This is where the debugging information and controls will be shown.
To create a breakpoint, we can click on the line number in the code editor in the top right of the debugging tools. If we right click one of the breakpoints, a popup menu will appear allowing us to disable the breakpoint temporarily or to remove the breakpoint.
Once we have set a breakpoint in some JavaScript, we can reload the page to run the code. The next diagram has set two breakpoints and reloaded the page. The code is shown paused at the first breakpoint.
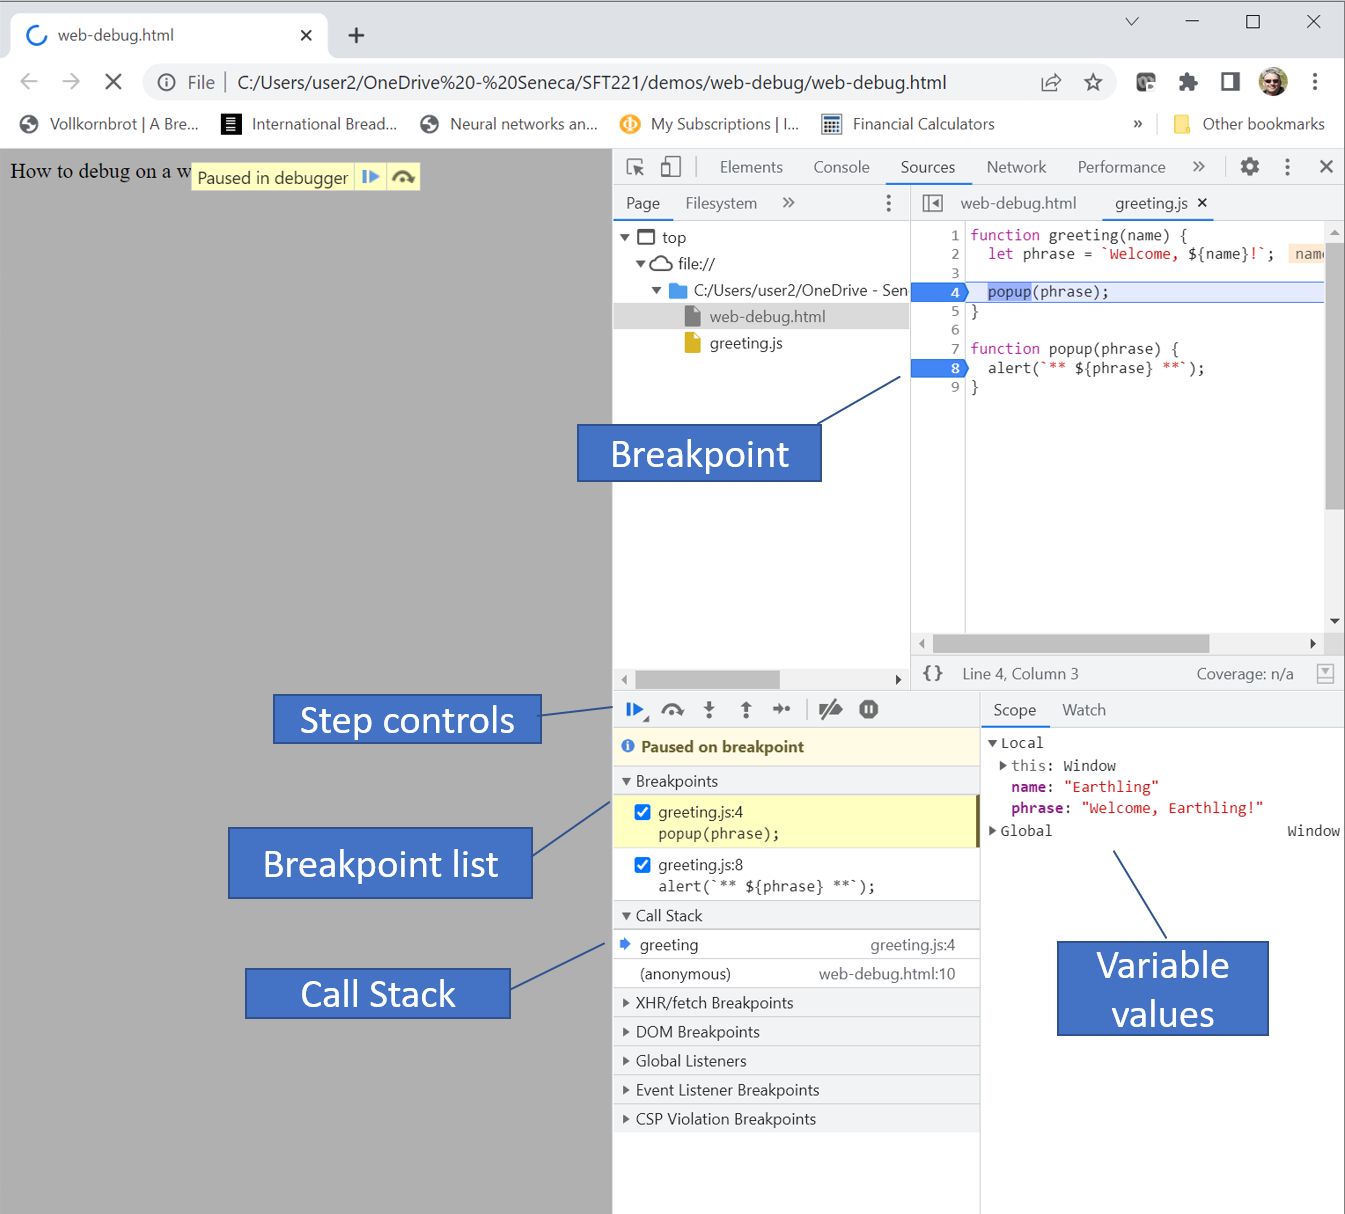
At this point, it is starting to look like any other debugger. We have breakpoints shown beside the code with a list of breakpoints in the tab at the bottom. In addition, the lower right pane is displaying a list of the variables and their values at the point where the code is paused. The variables are a tree and allow us to explore either the local or global variables. The call stack is also shown so we can see where the code is paused and how it got there.
There are a series of step controls that allow you to (left to right, as shown):
- resume execution
- step over the next line without going into a function
- step into the next function
- step out of current function
- step
- activate / deactivate all breakpoints
- pause on exceptions
You can also click on a line in the editor, right click and select Continue to here to execute util a specific location in the code.
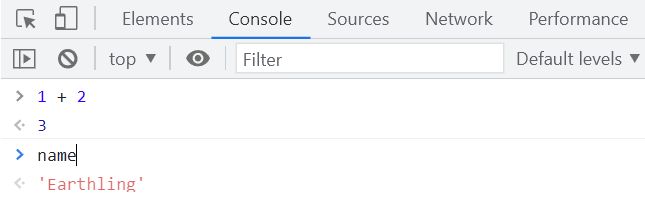
The console tab at the top right switches you to an interactive console where you can type JavaScript and have it evaluated. As the next diagram shows, you can type expressions, including those that reference variables in the active scope.