Visual Studio Debugging
Microsoft Visual Studio has an integrated debugger which makes it very easy to debug your programs. This is typicaly used when the use of print statements is not sufficient to find the bug. The interface for the debugger is shown below.
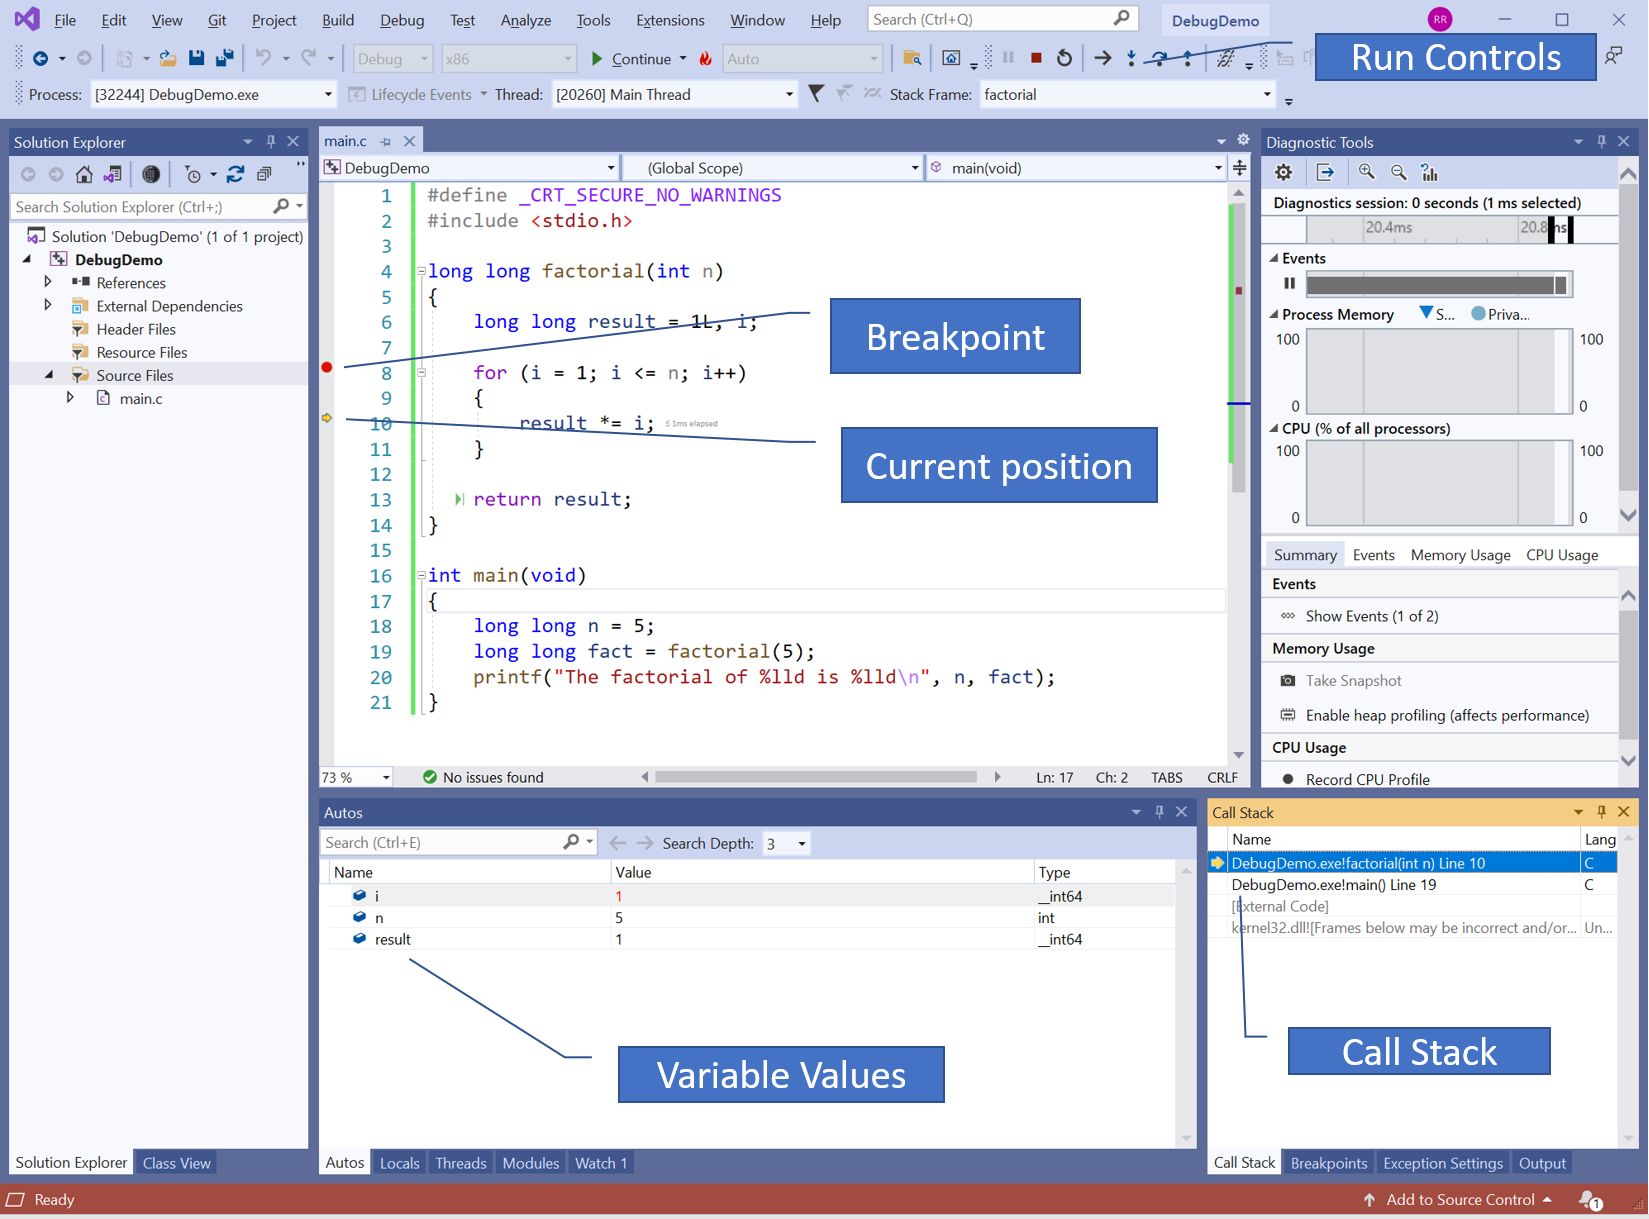
The callouts in the diagram show:
- the controls at the top of the window allow you to
- go to the next statement,
- execute into a function and stop
- execute until a function returns and stop,
- restart the execution,
- continue the execution until the next breakpoint
The vertical bar to the left of the code provides:
- the ability to set and remove breakpoints by clicking beside a line. A breakpoint is a point at which the code will pause execution and allow you to inspect the variables in a running program. Breakpoints are described in more detail later.
- A yellow arrow indicating the next line to be executed. As you execute the lines, this arrow will move to show you where you are in the code.
The bottom left pane shows the values of the variables and has tabs to display:
- the local variables,
- a list of variables whose value you want to watch.
The pane on the bottom right shows:
- the callstack which shows all the functions that have been called and the lines on which they are suspended,
- a list of breakpoints which can be temporarily disabled.
Breakpoints
Breakpoints can be set on any executable line of a program. The idea of a break point is that when the code is being debugged, and just before it hits the line on which a breakpoint has been set, execution will be paused. During the execution of a program, you will be able to examine the state of all the variables inside the program to see exactly what is going on. Once the program has paused, you will be able to use the run controls at the top of the window to step the program ahead, stopping at each line and examining the variables as you go along.
Run Controls
The run controls are at the top of the screen and allow you to control the program once it has hit a breakpoint and paused the execution. We will go through each of these controls in detail in the sections below.
Continue
![]() The continue control will resume execution until it either hits the next breakpoint or the program completes.
The continue control will resume execution until it either hits the next breakpoint or the program completes.
Restart
![]() Restart will stop the current execution of the program and restart it from the beginning. This is equivalent to stopping the program itself and then restarting the debugging session.
Restart will stop the current execution of the program and restart it from the beginning. This is equivalent to stopping the program itself and then restarting the debugging session.
Show next Statement
![]() The show next statement will position the cursor on the next statement in the code that is going to be executed.
The show next statement will position the cursor on the next statement in the code that is going to be executed.
Stop Debugging
![]() The stop debugging command will terminate the current debugging session and leave you back in the editor ready to do your next operation.
The stop debugging command will terminate the current debugging session and leave you back in the editor ready to do your next operation.
Step Into
![]() Execute into will resume execution and continue until it enters the next function call. It will then stop once it is inside that function. This is very useful if you want to trace the execution through a function call and then step it line by line through a function which is called. This is the best way to get the debugger to step into a function line by line.
Execute into will resume execution and continue until it enters the next function call. It will then stop once it is inside that function. This is very useful if you want to trace the execution through a function call and then step it line by line through a function which is called. This is the best way to get the debugger to step into a function line by line.
Step Over
![]() Step over is the usual way that you execute the next statement. It simply steps over the current statement while executing it and stops before executing the next statement. In the event that the statement you are stepping over is a function call, it will step over the function and go on to the next statement after the function call. If you actually want to step into the function and see how it works line by line inside, you should use step into.
Step over is the usual way that you execute the next statement. It simply steps over the current statement while executing it and stops before executing the next statement. In the event that the statement you are stepping over is a function call, it will step over the function and go on to the next statement after the function call. If you actually want to step into the function and see how it works line by line inside, you should use step into.
Step Out
![]() Step out will allow you to continue to the end of a function and then return to the point immediately after the line that called the function and then pause execution.
Step out will allow you to continue to the end of a function and then return to the point immediately after the line that called the function and then pause execution.
Run to Click
There is no button for this that is immediately visible but, if you hover over a line when the debugger is paused, a small green play button will appear at the start of the line of code. If you click that play button, the debugger will execute and pause just before the line you clicked on.
Autos and Locals
The pane at the bottom has several tabs to show different information. The Autos and Locals tabs show the values of automatic and local variables. What is shown will change based on the scope in which the debugger is paused. The variables will always be those for the current scope. In general, it will show the values of the variables. If the variable is an array, struct or class, it will allow you to expand it and see the internal structure of the variable.
Another handy way to see the value of local variables in the active scope is to simply hover your mouse over the variable name in the code and the value will popup in a small dialog window.
Watches
The watch tab is beside the autos and locals tab and allows you to watch specific variables and expressions. You can either type the name of the variable into the window or right click on the variable name in the code and select "Add watch" from the menu that appears. You can enter simple expressions into the window to have them calculated and displayed. Watched variables that go out of scope will be grayed out until they come back into scope.
The Call Stack
We will demonstrate the debugger on the following program.
0001 #define _CRT_SECURE_NO_WARNINGS
0002 #include <stdio.h>
0003
0004 #define NUM_TESTS 3
0005
0006 long long factorial(int n)
0007 {
0008	long long result = 1L, i;
0009
0010	for (i = 1; i <= n; i++)
0011	{
0012		result *= i;
0013	}
0014
0015	return result;
0016 }
0017
0019 int main(void)
0020 {
0021	int testValues[NUM_TESTS] = { 3, 5, 9 };
0022	long long n = 5;
0023	long long fact = 0L;
0024	int i = 0;
0025
0026	for (i = 0; i < NUM_TESTS; i++)
0027	{
0028		fact = factorial(testValues[i]);
0029		printf("The factorial of %d is %lld\n", testValues[i], fact);
0030	}
0031 }
The call stack window is a tab in the lower right pane. It displays the functions which are active and the lines the code is paused on in each function. The most recent function is shown at the top of the window.
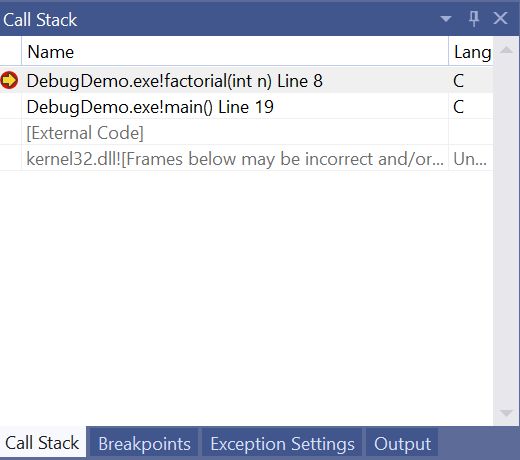
If you right click on one of the lines on which the program is suspended below the top one, a menu will appear allowing you to switch frame. This will show all of the local variables in that stack frame rather than in the top stack frame. You can use this technique to navigate through all the points at which functions were called in the program and examine the local variables at each point.
The Breakpoint Pane
Just to the right of the call stack is the breakpoint tab. This displays a list of breakpoints you have set in the program. Finding them listed here is much easier than searching all over the code to find them.
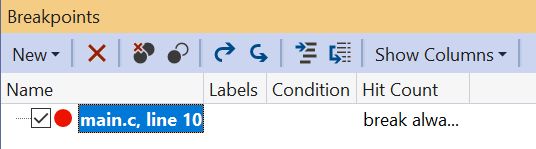
Each breakpoint has a checkmark to the left of it which can be clicked to temporarily disable the breakpoint. If you want to actually delete a breakpoint, there is an X button above the list of breakpoints that will delete the highlighted breakpoint. There is also a New button which can create two different types of breakpoints -- a function breakpoint and a data breakpoint.
A function breakpoint is the same type of breakpoint we have been using all along. It allows you to type the name of a function and it will suspend execution on the first line of that function when it is called.
A data breakpoint can be set to watch for changes in a specified number of bytes at a specific address in memory. Usually you set the address of one of your variables using the & operator to generate the address of the variable. For example, to watch myVariable, you would enter &myVariable to generate the address of that variable. Every time this variable is changed, a breakpoint will be triggered. This is a very powerful feature for finding the type of bug where one of your variables just seems to change its value all on its own. You can now watch for changes in the variable and identify the line of code which made the change.
The breakpoint settings window is shown below and can be displayed by either right clicking on the breakpoint in the breakpoint window or by right clicking on the red symbol for the breakpoint beside the line of code in the editor.
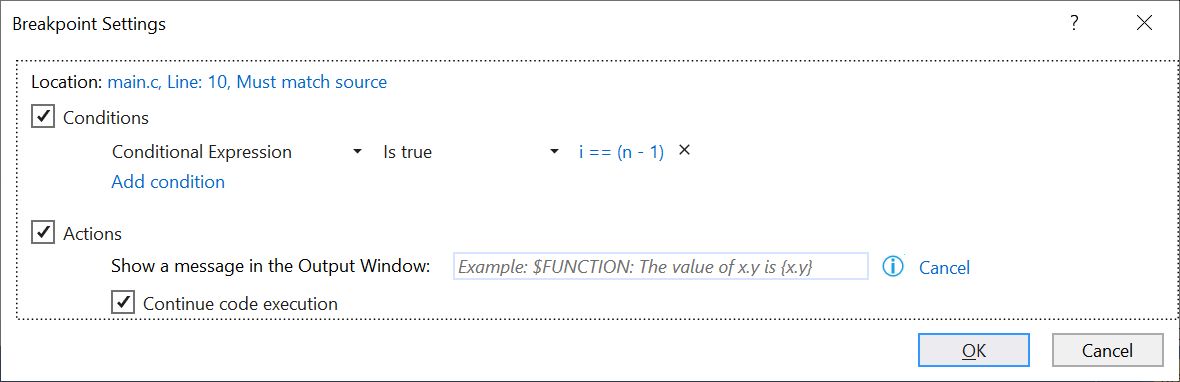
You can add conditions to the breakpoint which will trigger the breakpoint only when the condition is true. The condition can be any expression (eg. i == 5) which will trigger the breakpoint when true. You can add multiple conditions which will trigger the breakpoint when any one of them is true.
You can also set an action for a breakpoint. Actions print text to the output window of Visual Studio and have an effect similar to inserting print statements in your code. They are faster to set up than print statements, can be made conditional, and can be easily removed. Actions come with a set of pre-defined macros that start with a $ sign and one of the following names.
- $CALLER - The name of the function which called this function.
- $CALLSTACK - Displays the call stack showing how this function was called.
- $FILEPOS - The name of thecurrent file and the line of the breakpoint
- $FUNCTION - The name of the function containing the breakpoint
- $TICK - The number of milliseconds since the computer was started
In addition to this, you can quickly print the values of variables by putting their name inside curly braces. This will allow us to easily compose a message like this:
In $FUNCTION called from $CALLER: i = {i}
Below the action box, there is a tickbox Continue code execution. If this is checked then it transforms the breakpoint into a tracepoint. Tracepoints are simmilar to breakpoints but do not pause the execution of the program but just continue to execute.
Exporting and Importing Breakpoints
Breakpoints can be exported from the breakpoints pane using the curved arrow buttons at the top of the pane. This lets you create a set of breakpoints to debug a certain problem in the code and save them to an XML file. Since you might not have completely solved the problem, you can save the breakpoints and then reload them if the same problem ever occurs again. This saves you from having to delete and then recreate the breakpoints.